Which Country is the Most Passionate About Gaming?
When you are play video games online with others, have you ever wondered where the other players are gaming from? One incredible aspect about gaming is that it reaches nearly ever corner of Earth, uniting players from all backgrounds and cultures. The team at VR.Space loves exploring gaming statistics to gain insights on the thriving gaming industry, to educate avid gamers, and just for fun. So where are video games the most popular? Let’s find out:
Want to display this infographic on your website? You can copy the below code and paste it into your website.
<a href=”vr.space/news/games/country-most-passionate-gaming/”> <img decoding=”async” src=”vr.space/wp-content/uploads/2024/05/country-most-passionate-gaming-4_c.png” alt=”Which Country is the Most Passionate About Gaming? – VR Space Custom Virtual Reality Spaces – Infographic” title=”Which Country is the Most Passionate About Gaming? – VR.Space – Infographic”></a><br><a href=”https://www.vr.space/” alt=”VR Space Custom Virtual Reality Spaces” title=”VR.Space”>By VR.Space</a>
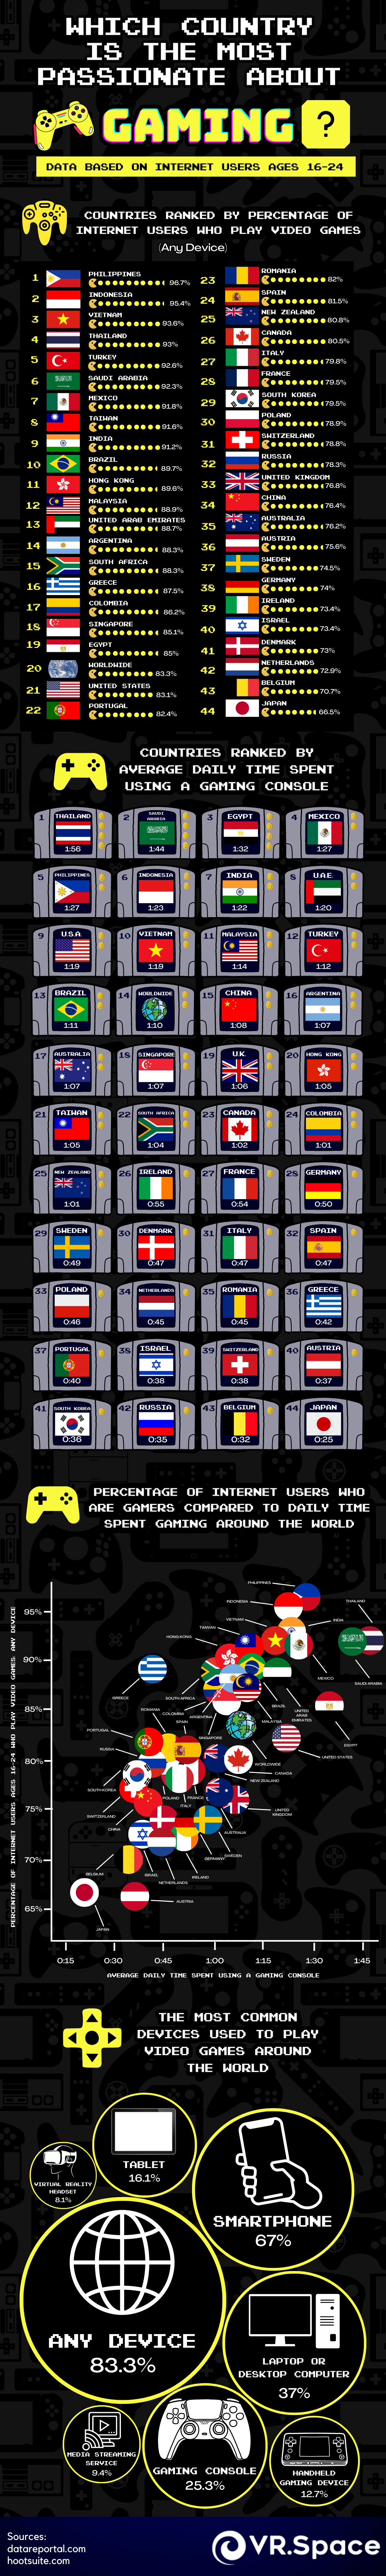
Which Country Has the Most Gamers?
Gaming is a beloved pastime (and for some, a lucrative profession!) around the world, but have you ever wondered what the gaming capital of the world might be? There are different ways to quantify that, so let’s take a look first at the percentage of gamers by country for insights into how passionate each country’s population is about gaming as a whole. Here are the 20 top gaming countries based on the proportion of the population of young adults who play video games daily, or global gaming penetration by country if you’re feeling fancy:
- Filipino gamers — 96.7%
- Indonesian gamers — 95.4%
- Vietnamese gamers — 93.6%
- Thai gamers — 93%
- Turkish gamers — 92.6%
- Saudi gamers — 92.3%
- Mexican gamers — 91.8%
- Taiwanese gamers — 91.6%
- Indian gamers — 91.2%
- Brazilian gamers — 89.7%
- Hong Kongese gamers — 89.6%
- Malaysian gamers — 88.9%
- United Arab Emirati gamers — 88.7%
- Argentinian gamers — 88.3%
- South African gamers — 88.3%
- Greek gamers — 87.5%
- Colombian gamers — 86.2%
- Singaporean gamers — 85.1%
- Egyptian gamers — 85%
- American gamers — 83.1%
Is gaming popular in the Philippines? Absolutely! However, there was once a dark age for gaming in the Philippines. Despite the Philippines’ passion for gaming today, video games were once banned in the gaming capital of the world. In 1981, President Ferdinand Marcos banned video games across the country, making it the first country to ban video games. The decree was issued in response to complaints from parents and educators who believed that games such as Asteroids and Space Invaders were detrimental to youth’s developing morals, deeming them as a “destructive social enemy” and “to the detriment of public interest.” This decree even extended to pinball machines, slot machines, and other similar gaming devices. Filipinos were given just two weeks to either destroy their video games and devices or surrender them to the army and police. Violators were required to pay a $600 fine and faced six months to a year in prison. Of course, this only forced gaming underground, which may have even fueled today’s Filipino frenzy for video games. Fortunately, this dark age of gaming did not last too long, as it was lifted following the 1986 People Power Revolution. Gamers always find a way!
What Is the Average Time Spent Playing Video Games in 2022?
Another way to measure a country’s passion for video gaming is to analyze how much time is spent playing video games on average every day. Surprisingly, the Philippines does not top the list of hours spent on video games by country. Let’s take a look:
- Thailand — 1:56
- Saudi Arabia — 1:44
- Egypt — 1:32
- Mexico — 1:27
- Philippines — 1:27
- Indonesia — 1:23
- India — 1:22
- United Arab Emirates — 1:20
- United States — 1:19
- Vietnam — 1:19
Here’s a full transcription of this worldwide video game popularity infographic to make it more accessible to all of our visitors:
Percentage of Internet Users Ages 16–24 Who Play Video Games (Any Device)
| Country | Percentage |
| Philippines | 96.7% |
| Indonesia | 95.4% |
| Vietnam | 93.6% |
| Thailand | 93% |
| Turkey | 92.6% |
| Saudi Arabia | 92.3% |
| Mexico | 91.8% |
| Taiwan | 91.6% |
| India | 91.2% |
| Brazil | 89.7% |
| Hong Kong | 89.6% |
| Malaysia | 88.9% |
| United Arab Emirates | 88.7% |
| Argentina | 88.3% |
| South Africa | 88.3% |
| Greece | 87.5% |
| Colombia | 86.2% |
| Singapore | 85.1% |
| Egypt | 85% |
| Worldwide | 83.3% |
| United States | 83.1% |
| Portugal | 82.4% |
| Romania | 82% |
| Spain | 81.5% |
| New Zealand | 80.8% |
| Canada | 80.5% |
| Italy | 79.8% |
| France | 79.5% |
| South Korea | 79.5% |
| Poland | 78.9% |
| Switzerland | 78.8% |
| Russia | 78.3% |
| United Kingdom | 76.8% |
| China | 76.4% |
| Australia | 76.2% |
| Austria | 75.6% |
| Sweden | 74.5% |
| Germany | 74% |
| Ireland | 73.4% |
| Israel | 73.4% |
| Denmark | 73% |
| Netherlands | 72.9% |
| Belgium | 70.7% |
| Japan | 66.5% |
Average Daily Time Spent Using a Gaming Console
| Country | Time (Hours and Minutes) |
| Thailand | 1:56 |
| Saudi Arabia | 1:44 |
| Egypt | 1:32 |
| Mexico | 1:27 |
| Philippines | 1:27 |
| Indonesia | 1:23 |
| India | 1:22 |
| United Arab Emirates | 1:20 |
| United States | 1:19 |
| Vietnam | 1:19 |
| Malaysia | 1:14 |
| Turkey | 1:12 |
| Brazil | 1:11 |
| Worldwide | 1:10 |
| China | 1:08 |
| Argentina | 1:07 |
| Australia | 1:07 |
| Singapore | 1:07 |
| United Kingdom | 1:06 |
| Hong Kong | 1:05 |
| Taiwan | 1:05 |
| South Africa | 1:04 |
| Canada | 1:02 |
| Colombia | 1:01 |
| New Zealand | 1:01 |
| Ireland | 0:55 |
| France | 0:54 |
| Germany | 0:50 |
| Sweden | 0:49 |
| Denmark | 0:47 |
| Italy | 0:47 |
| Spain | 0:47 |
| Poland | 0:46 |
| Netherlands | 0:45 |
| Romania | 0:45 |
| Greece | 0:42 |
| Portugal | 0:40 |
| Israel | 0:38 |
| Switzerland | 0:38 |
| Austria | 0:37 |
| South Korea | 0:36 |
| Russia | 0:35 |
| Belgium | 0:32 |
| Japan | 0:25 |
Devices Used to Play Video Games
| Device | Percentage |
| Any device | 83.3% |
| Smartphone | 67% |
| Laptop or desktop computer | 37% |
| Gaming console | 25.3% |
| Tablet | 16.1% |
| Handheld gaming device | 12.7% |
| Media streaming service | 9.4% |
| Virtual reality headset | 8.1% |
Related: Custom VR Spaces